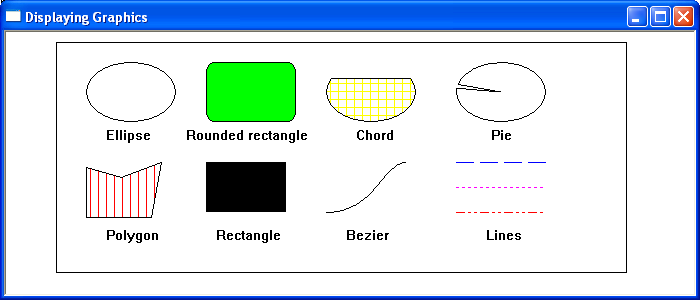
In addition to displaying text, most Windows applications make extensive use of graphics to present information visually. The Windows Graphics Device Interface (GDI) provides a comprehensive set of drawing functions that enable applications to render lines, curves, geometric shapes, bitmaps, icons and other graphical objects on the screen, printer or other output devices.
The GDI drawing functions operate using simple geometric primitives. More complex illustrations can be created by combining these primitives, allowing applications to construct everything from simple diagrams and charts to sophisticated user interfaces.
The appearance of graphical objects is determined by the current drawing attributes selected into the device context. In particular, pens define the colour, style and thickness of outlines, while brushes determine the colour and pattern used to fill enclosed shapes. Applications may also select fonts, bitmaps and other graphical objects to customise the appearance of their output.
As with text output, graphical drawing should normally be performed while processing the WM_PAINT message. This ensures that the application’s graphical output is automatically restored whenever the window requires repainting.
Windows provides a wide range of graphics functions, some of the most commonly are listed below:
Drawing Pixels
A pixel is the smallest image element that can be represented on screen. To draw a point within the client area of a window use the API function SetPixel(). The prototype for this function is
COLORREF SetPixel(HDC hdc,int x,int y,COLORREF color);
Where
hdc – the device context.
X – The x-coordinate, in logical units, of the point to be set.
Y – The y-coordinate, in logical units, of the point to be set.
Colour – is a COLORREF to paint the point. If the colour cannot be created on the video display, Windows will use the nearest pure non-dithered colour and then return that value from the function.
If the function is successful, the return value is the RGB colour. If the function fails, the return value is -1.
Drawing Lines
The LineTo() function draws a line within the client area from the current graphics drawing point. The prototype for this function is:
BOOL LineTo(HDC hdc, int x, int y);
where
hdc – the device context.
x – specifies the x-coordinate of the line’s ending point.
y – specifies the y-coordinate of the line’s ending point.
If the function succeeds, the return value is nonzero. If the function fails, the return value is zero. The new starting point will then become the endpoint of the previous line.
MoveToEx
The initial starting position for graphics output will be the screen coordinate position 0,0. MoveToEx() is a Win32 GDI drawing function used to set the current drawing position in a device context.
The prototype for the MoveToEx function is:
BOOL MoveToEx(HDC hdc,int x,int y,LPPOINT lppt);
where
hdc – handle to a device context.
x – specifies the x-coordinate of the new position, in logical units.
y – specifies the y-coordinate of the new position, in logical units.
Lppt – is a pointer to a POINT structure that receives the previous current position.
If the function succeeds, the return value is nonzero. If the function fails, the return value is zero.
GetCurrentPosition
Retrieves the current logical graphics starting position. The prototype of this function is:
BOOL GetCurrentPositionEx(HDC hdc,LPPOINT lppt);
Where
hdc – handle to the device context
lppt – is a pointer to a POINT structure that receives the logical coordinates of the current position.
If the function succeeds, the return value is nonzero. If the function fails, the return value is zero.
Drawing Rectangles
The simplest function for drawing rectangles is Rectangle(). It draws a rectangle using the current pen and brush. The prototype is:
BOOL Rectangle(HDC hdc,int left,int top,int right,int bottom);
hdc – is a handle to the device context.
Left – is the x-coordinate of the upper-left corner of the rectangle.
Top – is the y-coordinate of the upper-left corner of the rectangle.
Right – the x-coordinate of the lower-right corner of the rectangle.
Bottom – the y-coordinate of the lower-right corner of the rectangle.
If the function succeeds, the return value is nonzero. If the function fails, the return value is zero.
To display rectangles with rounded corners using the API function RoundRect(). The prototype for this function is
BOOL RoundRect(HDC hdc, int left,int top,int right,int bottom,int width,int height);
where
hdc – A handle to the device context.
Left – The x-coordinate of the upper-left corner of the rectangle.
Top– The y-coordinate of the upper-left corner of the rectangle.
Right – The x-coordinate of the lower-right corner of the rectangle.
Bottom – The y-coordinate of the lower-right corner of the rectangle.
Width – The width, of the ellipse used to draw the rounded corners.
Height – The height of the ellipse used to draw the rounded corners.
If the function succeeds, the return value is nonzero.If the function fails, the return value is zero.
Drawing an Ellipse
To draw an ellipse or circle using the current pen and filled by the current brush, use the Ellipse() function. The prototype is:
BOOL Ellipse(HDC hdc,int left,int top,int right,int bottom);
where
hdc – A handle to the device context.
left – is the x-coordinate of the upper-left corner of the bounding rectangle.
Top – is the y-coordinate of the upper-left corner of the bounding rectangle.
Right – is the x-coordinate of the lower-right corner of the bounding rectangle.
Bottom – is the y-coordinate of the lower-right corner of the bounding rectangle.
If the function succeeds, the return value is nonzero. If the function fails, the return value is zero.
To draw a circle, the bounding rectangle must be a square. For example, to draw a circle that has a centre (50,50) with a radius of 10, use the following function parameters – Ellipse(hdc,10,10,50,50);
Drawing a Semi-Circular Wedge
To draw a semi-circular wedge using the current pen and fill it with the current brush, use the API function Pie(). The prototype of this function is
BOOL Pie(HDC hdc,int left,int top,int right,int bottom,int xr1,int yr1, int xr2,int yr2);
where
hdc – A handle to the device context.
Left – The x-coordinate of the upper-left corner of the bounding rectangle.
Top – The y-coordinate of the upper-left corner of the bounding rectangle.
Right – The x-coordinate of the lower-right corner of the bounding rectangle.
Bottom – The y-coordinate of the lower-right corner of the bounding rectangle.
xr1 – The x-coordinate of the endpoint of the first radial.
yr1 -The y-coordinate of the endpoint of the first radial.
xr2 – The x-coordinate of the endpoint of the second radial.
yr2 – The y-coordinate of the endpoint of the second radial.
If the function succeeds, the return value is nonzero. If the function fails, the return value is zero.
Drawing a Chord
A chord is the region bounded by an elliptical arc and the straight line joining the arc’s start and end points.. To draw a Chord using the current pen and fill it using the current brush, use the API function Chord(). The prototype of this function is –
BOOL Chord( HDC hdc,int x1,int y1,int x2,int y2,int x3,int y3,int x4, int y4);
hdc – handle to the device context.
x1 – The x-coordinate of the upper-left corner of the bounding rectangle.
y1 – The y-coordinate of the upper-left corner of the bounding rectangle.
x2 – The x-coordinate of the lower-right corner of the bounding rectangle.
y2 – The y-coordinate of the lower-right corner of the bounding rectangle.
x3 – The x-coordinate of the endpoint of the radial defining the beginning of the chord.
y3 – The y-coordinate of the endpoint of the radial defining the beginning of the chord.
x4 – The x-coordinate of the endpoint of the radial defining the end of the chord.
y4 – The y-coordinate of the endpoint of the radial defining the end of the chord.
If the function succeeds, the return value is nonzero. If the function fails, the return value is zero
Drawing Polygons
The Polygon() function draws a closed shape made from multiple connected lines. The interior of the shape is filled using the current brush, and the border is drawn using the current pen.
Unlike Polyline(), Polygon() automatically closes the shape by drawing a line from the last point back to the first.
BOOL Polygon(HDC hdc,const POINT *apt,int cpt);
hdc – A handle to the device context.
apt – A pointer to an array of POINT structures that specify the vertices of the polygon
cpt – The number of vertices in the array. This value must be greater than or equal to 2.
If the function succeeds, the return value is nonzero. If the function fails, the return value is zero.#
Bézier Curves
A Bézier curve is a smooth mathematical curve defined by a set of control points. Rather than specifying every point on the curve, the programmer specifies a small number of points, and Windows calculates the smooth curve that passes through the start and end points while being influenced by the intermediate control points. The PolyBezier() function draws one or more Bézier curves. The prototype of this function is
BOOL PolyBezier(HDC hdc,const POINT *apt,DWORD cpt);
where
hdc – A handle to a device context.
apt – A pointer to an array of POINT structures that contain the endpoints and control points of the curve(s), in logical units.
cpt – The number of points in the lppt array. This value must be one more than three times the number of curves to be drawn.
If the function succeeds, the return value is nonzero. If the function fails, the return value is zero.
Example
The following code builds on the basic window to display Windows graphics